Direct mail statistics for Canada with sources for 2026
October 15, 2026
Direct mail statistics for Canada, with source dates and survey limits. Check what Canadians notice, how mail volumes changed and what benchmarks can tell you.
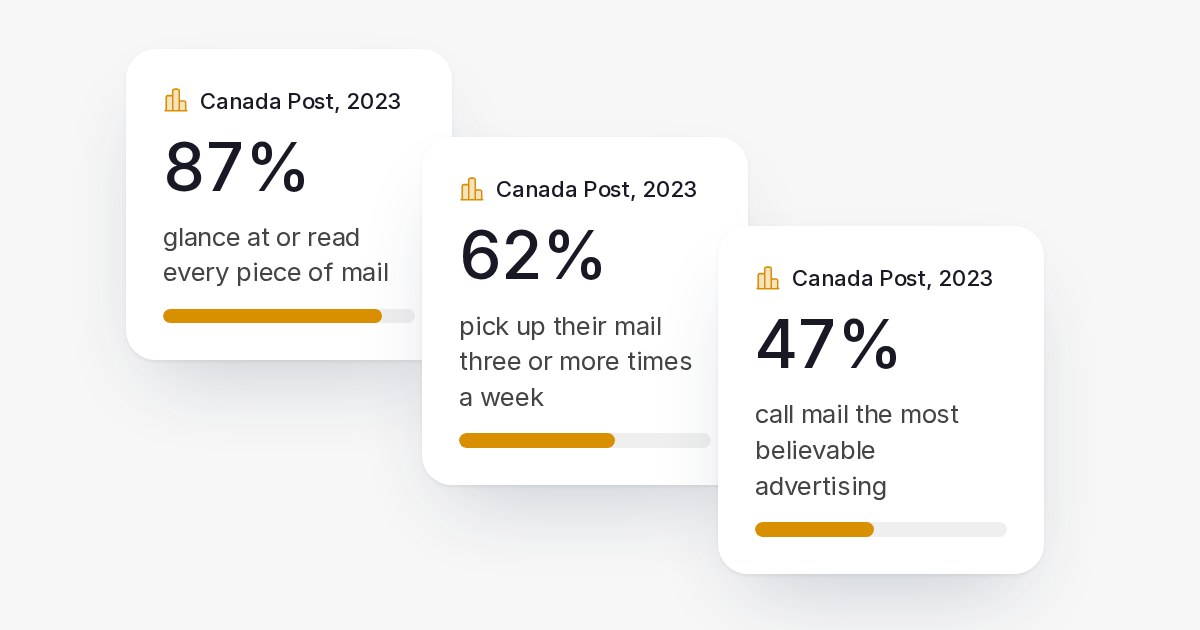
Direct mail statistics from Canada Post’s February 2023 research show that 87% of respondents glanced at or read every item they received. That measures reported attention, not purchases or campaign response.
Keep those measures separate when deciding whether mail belongs in your marketing plan. A reader noticing an offer, a customer responding and a campaign adding profit are different outcomes.
Sources were reviewed on October 15, 2026. The table below preserves the scope of each finding.
Check what Canadians say about their mail
Canada Post’s household research summary describes research involving 4,000 Canadians, dated February 2023.
| Finding | What the source reports | Limit |
|---|---|---|
| Attention | 87% glanced at or read every item | Includes glancing; it is not an open rate |
| Reading behaviour | 60% glanced; 27% read or opened every item | Self-reported behaviour |
| Collection | 62% collected mail at least three times a week | Collection is not immediate reading |
| Believability | 47% called coupons by mail the most believable advertising | The finding concerns coupons specifically |
When a presentation says that everyone who notices mail reads the full message, it goes beyond these findings. A short headline, recognizable sender and clear next action still need to earn the reader’s attention.
Bring your next offer to Canadian customers with our direct mail services. We handle the address checks, printing and postage; you choose the audience and message.
Put mail-volume changes in context
Canada Post’s 2025 annual-report executive summary reports approximately 5.5 billion letters in 2006 and about 2 billion in 2025. Over that period, addresses served increased by nearly 3.6 million and letter mail per address fell by 70%.
These are network-level figures. They describe the postal system’s workload, rather than the response to a particular offer.
Do not turn a decline in total letters into a claim that your postcard will face a specific amount of competition in each mailbox. A campaign decision still needs information about your audience, your offer and the alternatives available to your customer.
Use current postage data for the budget
Postage belongs in the budget, but it is separate from evidence that a campaign worked.
Canada Post’s commercial notices list current price schedules and effective dates. Save the relevant service, format and date with your estimate, then compare the complete mailing cost.
A postage-only schedule does not include every expense a business may incur. Design, printing, audience preparation and measurement can change the campaign total. When a provider offers an all-in rate, check exactly what that rate includes before adding costs again.
Separate response rates from return on investment
A response rate counts people who take a defined action. ROI compares the additional profit produced by a campaign with its cost. A high response rate can still leave a campaign unprofitable if the offer costs too much to fulfil.
The ANA’s 2021 study announcement, published January 24, 2022, reports 112% ROI for letter-sized envelopes sent to prospect lists. Its online survey collected self-reported data during 2021 and retained 581 sufficiently complete responses. This is a U.S. finding for a specific format and audience, not a Canadian postcard response benchmark.
This review did not establish a current national Canadian response-rate benchmark that could be applied to every campaign. Use a target based on your own margin and mailing cost, and measure the result consistently.
Measure response in your own customer records. Keep those records alongside the mailing counts and spend available in Direct Mailer. Response matching and holdout analysis happen in your own data; Direct Mailer’s analytics report mailing activity.
Check the origin before repeating a number
Use this source check when reviewing a vendor deck or a marketing article.
| Question | What to retain |
|---|---|
| Who published the original finding? | Researcher or organization and direct source |
| What year was measured? | Fieldwork period, not just article publication date |
| Which country? | Canada, U.S. or another named market |
| Who participated? | Household respondents, marketers or campaign records |
| What was measured? | Attention, response, orders, revenue or profit |
| What is the denominator? | People, mailings, respondents or campaigns |
| How was it measured? | Survey, operational records or controlled experiment |
A source hosted by a Canadian organization can describe research from another country. A newly updated article can repeat an old survey. Preserve those distinctions in the sentence where you use the number.
Treat mailbox conversions as a delivery change
On April 16, 2026, Canada Post described a program to convert approximately four million door-to-door addresses to community mailboxes over about five years. On June 11, 2026, it announced approximately 485,000 additional addresses in 37 communities for 2027, beyond the earlier phase.
These announcements describe planned delivery arrangements. They do not demonstrate a change in campaign response or prove that a recipient collected a particular letter.
For a time-sensitive promotion, allow room between mailing, estimated arrival and the deadline to act.
Keep the evidence usable
Record the exact measure, geography, study date and source URL when you save a statistic. If the full method is unavailable, keep that limitation beside the number.
This page uses publicly accessible primary material for the findings quoted above.
Suggested citation: Direct Mailer, “Direct mail statistics for Canada with sources for 2026,” October 15, 2026. For a research finding, cite the original source linked next to it so readers can check the scope themselves.
Common research questions
Does attention prove direct mail is effective?
Attention is one input. To assess commercial effectiveness, define the outcome you want and compare the resulting profit with the full campaign cost.
What is a good response rate?
Use the response rate that covers your campaign cost at your expected profit per response as the starting point. Then check whether the campaign adds enough profit to justify repeating it.
Can I use a U.S. benchmark in a Canadian plan?
Label its country, date, audience and method. Treat it as context when planning a test, and keep it separate from your measured Canadian result.