Direct mail response rate figures and their source limits
October 15, 2026
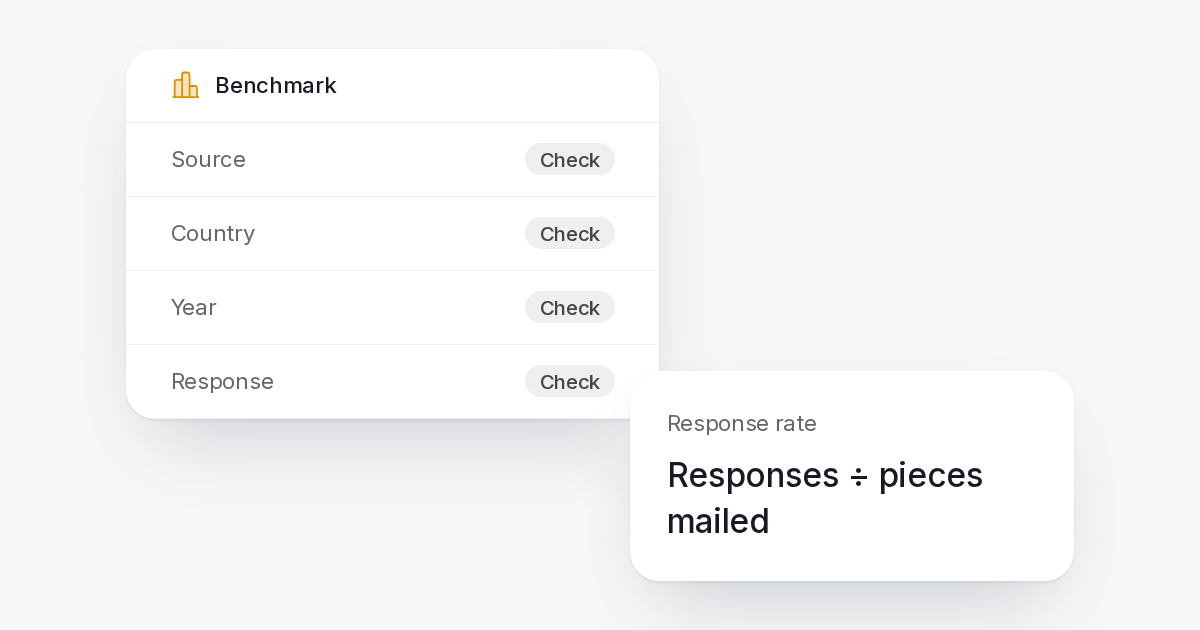
Direct mail response rate claims need a source, date and audience. Check the limits of popular benchmarks and calculate what your Canadian campaign needs.
A direct mail response rate is the share of recipients who take an action you define, such as calling, replying or placing an order. A useful benchmark must use the same action, a comparable audience and a clearly stated measurement window.
For a Canadian campaign, begin with your break-even point. A rate copied from an old overseas survey cannot tell you whether your offer will pay for itself. It can help form a question to test, provided you retain the source’s country, year and method.
Define the response before calculating it
Choose an action that matches the purpose of the campaign. A request for a property valuation, a donation and a completed purchase are different outcomes.
Write the definition before you mail. Include the start and end of the measurement window and whether you will count unique people or total actions.
Use a consistent denominator:
Response rate = unique responding recipients ÷ recipients in the defined mailing audience
If you use mailed recipients as the denominator, label it that way. If you exclude returned mail, document the rule and apply it consistently. Ordinary mail does not give you confirmed delivery for every recipient, so a denominator called “delivered” can imply evidence you do not have.
Check the repeated 4.4% claim carefully
The frequently repeated 4.4% figure is sometimes linked to the DMA’s 2012 research. The accessible evidence reviewed for this article did not verify that specific chain.
Rochester Institute of Technology’s June 2012 summary instead reports a 3.4% average response for direct mail to existing customers. It describes an April 2012 survey with 481 usable responses. That is a secondary summary of U.S. research, included here to document the source discrepancy rather than establish a current benchmark.
Do not replace one unexplained number with another. Before applying a historical rate, find the original measure and determine whether it describes existing customers, prospects, a particular format or a combination of campaigns.
If you cannot establish those details, leave the number out of the forecast.
A Canadian host does not establish Canadian research
Canada Post’s January 2009 media-response fact sheet cites the DMA’s 2006 response-rate research, published in 2007. Its discussion concerns U.S. results.
The Canadian publisher’s location and the U.S. study market are separate facts.
Check the source footnotes before copying a figure into your plan. Record the year measured, geography and campaign objective. Preserve any distinction between lead generation and a direct order.
A search result can stay visible long after the underlying research stops being suitable for a current forecast.
ROI findings measure something different
The ANA’s 2021 research announcement reports a 112% ROI finding for prospect mail in letter-sized envelopes. The announcement describes self-reported online survey data and 581 sufficiently complete responses across the study.
ROI is not response rate. The reported return for one format cannot supply an expected response percentage for a Canadian postcard campaign.
Keep these measures separate in your reporting:
| Measure | What it answers |
|---|---|
| Response rate | How many recipients took the defined action? |
| Conversion rate | How many completed the conversion you chose? |
| Revenue | What sales were recorded? |
| Contribution | What remained after the variable costs of those sales? |
| Incremental return | What changed because the audience received mail? |
A purchase following a postcard is a useful observation. Establishing how many purchases the postcard caused needs a comparison with what would otherwise have happened.
Calculate the response rate you need
Build the target from your campaign economics.
Break-even responses = total campaign cost ÷ contribution per response
Break-even response rate = break-even responses ÷ mailing audience
Contribution per response should reflect the action you count. If the response is a sales enquiry, include your expected conversion to a customer and the contribution from that customer. Counting every enquiry as a completed sale inflates the forecast.
Include creative work, mailing and other campaign costs in the total. Apply the same accounting scope when you compare the forecast with the result.
Use the direct mail ROI calculator with your own assumptions. Change the inputs to see how much room the campaign has if response is lower than you expect or fulfilment costs rise.
Measure your own campaign consistently
Save the audience before launch, with the campaign identifier, offer and planned measurement window. If you want to estimate incremental impact, assign a comparable group at random to receive no mail and retain that assignment in your own records.
Keep other marketing treatment consistent where practical. If the mailed group also receives an extra email or a different offer, your comparison measures the combined treatment.
Use direct mail analytics to check mailing counts, spend, statuses, time to mail and returns. Collect calls, replies and orders in your own sales or customer system. Direct Mailer does not match orders or calculate attributed revenue for you.
Compare response on the same basis across campaigns. A late change in the window or denominator can make an ordinary result look better without improving the campaign.
Read the source table before using a benchmark
| Material reviewed | Date and market | What it can establish |
|---|---|---|
| RIT’s summary of DMA research | 2012, U.S. | An accessible historical summary; the stated existing-customer figure differs from the repeated claim above |
| Canada Post media-response fact sheet | January 2009, citing U.S. 2006 research | Historical context, not a current Canadian average |
| ANA study announcement | Published January 2022, reporting 2021 U.S. research | Self-reported ROI for specified formats and audiences |
| Your campaign records | Your chosen dates and audience | The response you observed using your declared rules |
Sources were checked on October 15, 2026. This review did not establish a current national Canadian response-rate benchmark. Use historical research to understand how a claim was formed, then decide your next send from your own costs and results.